US Government Taxes and Revenue Since 1900
Government revenue, from taxes, fees, and business revenue, has increased substantially in the 20th century. There have
also been remarkable changes in the type of taxes raised and in the relative taxing power by type of government.
A Century of Government Revenue
Government Revenue in the United States has steadily increased from 7 percent of GDP in 1902 to an expected
35.3 percent GDP in
2026.
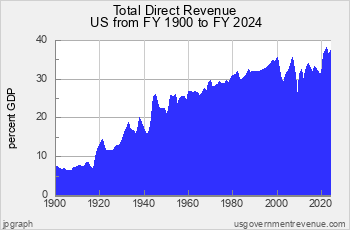
Chart 3.21: Total Revenue in 20th C. as Pct GDP
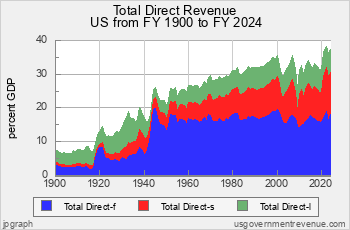
Chart 3.22: Fed., State, Local Revenue in 20th C.
Government Revenue started out at the beginning of the 20th century at seven percent of Gross Domestic Product (GDP).
As you can see from Chart 3.22, the federal share of revenue in 1900 was modest, at 3.22 percent of GDP.
State revenue was a modest 0.81 percent of GDP and local revenue was 3.78 percent of GDP.
But this relationship was not to last.
The federal income tax was passed in 1913 and federal revenue rose rapidly in World War I,
peaking at 8.3 percent of GDP in 1921 as total government revenue peaked at 14.6 percent of GDP.
For the rest of the 1920s government revenue held at about 11 to 12 percent of GDP, but tax increases at the nadir of the
Great Depression increased the government take to 18.9 percent in 1933 (5.7 percent Federal, 4.13 percent State and 9.04 percent Local) and 20 percent in 1938 right after the 1937 recession (8.27 percent federal, 5.28 percent State and 6.46 percent Local). The trend was clear; taxing power was moving from the local level up to state governments and to the federal government.
Chart Key:

- Local revenue

- State revenue

- Federal revenue
In World War II the government tax take rose sharply again, peaking at 30 percent of GDP in 1945. This revenue was split
unequally between the levels of government. Federal revenue in 1945 reached 23.3 percent of GDP, State revenue was down to 3.16 percent, and local revenue down to 3.09 percent.
In the post World War II era government revenue fell back initially but then began a slow increase, peaking at 32 percent of GDP in the recession year of 1982 and 33.2 percent of GDP in the recession year of 2001.
Federal revenue has remained relatively steady, holding between 15 and 20
percent of GDP. But state and local revenue have increased substantially. State revenue broke 8 percent of GDP in 1985 and thereafter has fluctuated between 8 and 10 percent of GDP. Local revenue broke 6 percent in 1983 and thereafter has fluctuated between 6 and 7.5 percent of GDP.
The sharp breaks in state and local revenue in 2001 and 2009 reflect capital losses in state and
local government pension funds experienced in the bear market of 2001-02 and the Crash of 2008.
Revenue Sources by Type since 1900
In 1900, government revenues came mainly from ad-valorem taxes. Since World War II government revenue has come mostly from income-based taxes.

Chart 3.23: US Govt. Revenue by Type
At the beginning of the 20th century, government revenue came almost exclusively from ad-valorem taxes. The federal government obtained its revenue from import tariffs and state and local governments obtained revenue from property taxes.
Things began to change with the passage of the federal income tax in 1913. Income tax collections went to 4.67 percent of
GDP in 1921 in the aftermath of World War I, before settling down at about 2 percent of GDP during most of the 1920s and 1930s.
Income taxes ballooned to 15.7 percent of GDP in the war year of 1944, but settled down to 11 to 12 percent thereafter.
Ad-valorem taxes went from about 5 to 6 percent of GDP in the early decades of the century to about 8.5 percent of GDP at the end of the 1920s boom, peaking at 14.1 percent of GDP in the depths of the Great Depression in 1933. Ad-valorem taxes declined after World War II. They yielded about 11 to 12 percent of GDP in the 1950s and then slowly declined to 7.5 percent of GDP by the 2000s.
Chart Key:

- Social insurance taxes

- Business revenue
- Fees & charges
- Ad-valorem taxes
- Income taxes
Fees and charges yielded about 0.5 percent of GDP in the 1900s and slowly increased to about one percent of GDP by the 1930s.
They started to increase again after World War II, peaking at 3.6 percent in 1991 and then
declining to 2.5 percent of GDP by the 2000s.
Social insurance taxes began seriously in 1937 when FICA taxes started up to fund Social Security. Social insurance
taxes were 0.69 percent of GDP in the first year of FICA, rising to 2.84 percent by 1940. Since World War II
social insurance taxes have steadily increased, hitting 3 percent GDP in 1958, 4 percent GDP in 1963, 5 percent
GDP in 1970, 6 percent GDP in 1974, 7 percent of GDP in 1980, and 8 percent of GDP in 1986. Social insurance
taxes first hit 9 percent of GDP in 1997, 10 percent of GDP in 2007. Since then social insurance taxes have
fluctuated between 9 and 10 percent of GDP, except in recession years when state government pension plans experience heavy losses.
Revenue Breakdown by Level of Government
The federal government raises revenue principally from income and social insurance taxes. State
government revenue breaks down about equally between income taxes, ad-valorem taxes, and fees and business revenue. Local
government revenue is about half ad-valorem taxes and half fees and business revenue.

Chart 3.24: Federal Revenue in 20th Century
At the beginning of the 20th century governments at all levels in the United States raised almost all their revenue
from ad-valorem taxes: tariffs, sales taxes, and property taxes.
Starting in World War I, after the passage of the federal income tax, federal revenue became increasingly dependent
upon income taxes. After the passage of the Social Security Act in 1935, the income tax was augmented
by social insurance taxes, i.e, taxes on wage income.
From the 1950s to the 1990s federal income tax revenues slowly declined as a percent of GDP from 13 percent down to 10
percent. In the 2000s federal income tax fluctuated between 8 and 12 percent of GDP, before declining to
7.3 percent GDP in 2009 and 2010 in the Great Recession. Federal income tax revenues hit
10.3 percent GDP in 2015, and are budgeted at 9.3 percent GDP in 2020.
Federal social insurance revenues have steadily increased since the start of Social Security in 1937. Starting
at 0.33 percent of GDP in 1937, social insurance revenues hit 1 percent of GDP in 1949, 2 percent of
GDP in 1960, 3 percent of GDP in 1963, 4 percent of GDP in 1970, 5 percent of GDP in 1979, and 6 percent of
GDP in 1985. Social insurance revenues peaked at 6.5 percent of GDP in 2001 and then declined to 6 percent GDP in the mid 2000s. Social insurance revenues dropped to 5.2 percent GDP in 2011 and 2012
due to a temporary reduction in FICA tax to stimulate the economy, but got back almost to 6 percent GDP in 2016.

Chart 3.25: State Revenue in 20th Century
State revenue at the beginning of the 20th century came almost exclusively from ad-valorem taxes.
States began to get revenues from income taxes in the 1920s and from social insurance taxes beginning in the 1930s. But
the principal source of revenue remained ad-valorem taxes.
State income taxes began to ramp up in the 1970s, but flattened
after 1990.
Revenue from fees, employee retirement operations, and lotteries began to represent
a large share of revenue in the 1980s and thereafter. Fluctuations in social insurance revenues reflect sudden
losses experienced by state employee pension funds during financial market downturns.

Chart 3.26: Local Revenue in 20th Century
Local revenues are collected principally through ad-valorem taxes, such as sales taxes
and property taxes on real estate. Income taxes and
social insurance taxes remain negligible in most localities.
Fees and business income have steadily increased as a share of revenue throughout
the 20th century.
From the 1980s to the present, local government Ad-Valorem taxes have increased from
about 3 percent GDP to 3.5 percent GDP. Fees and Charges have fluctuated between 1.5 percent
GDP and 2 percent GDP. Business and Other Revenue has increased from 0.6 percent GDP in
the 1970s to 1.5 percent GDP in the 2000s and back to to 1.3 percent in the 2010s.


