Site Map 

Revenue Analyses:

Income Tax Analyses:

Numbers — Charts:


    Contact    
smaller text  bigger text    print view

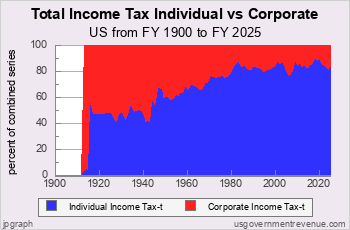
What is the US Income Tax Revenue?

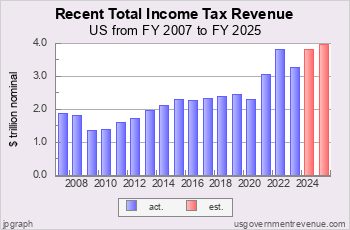
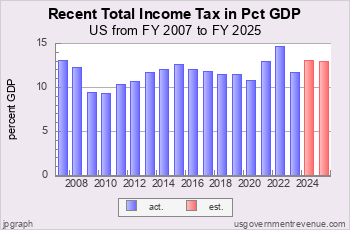
In FY 2025, total US income tax revenue — federal, state and local — was $3,972 billion according to the Office of Management and Budget report of federal revenue and usgovernmentrevenue.com’s “guesstimate” of state income taxes. Individual income taxes collected $3,306 billion and corporate income taxes collected $666 billion.

Estimated total income tax revenue — federal, state and local — for FY 2026 is $3,915 billion.

Total US Income Tax Analysis


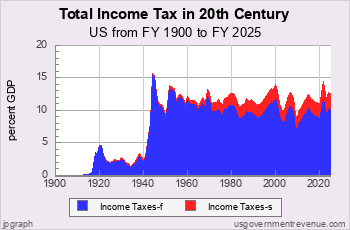
This page shows the current trends in US National Income Tax revenue. There are also charts on US National Income Tax revenue history.

Recent US Total Income Tax Revenue

Recent Income Tax Revenue

Chart R.11t: Recent Income Tax Revenue

Total US Income Tax Revenue, federal and state, was increasing in the mid 2000s, about $1.9 trillion in 2007. In the Great Recession income tax plunged beloa $1.4 trillion in FY 2009. Since then total US income tax revenue has grown to $2.4 trillion in 2019. Income tax revenues exploded in the aftermath of COVID.

Estimated total income tax revenue for 2025 was $4.0 trillion.

Recent Income Tax as Pct GDP

Chart R.12t: Recent Income Tax as Pct GDP

Viewed from a GDP perspective, total US income tax revenue plunged from about 13 percent of GDP in the 2000s to 9 percent GDP in the Great Recession. Revenues climbed to just under 13 percent GDP in 2015 and then declined to 10.6 percent GDP in 2019.

Estimated total income tax revenue for 2025 was 12.9 percent GDP.

Revenue Analyses:

Income Tax Analyses:

Numbers — Charts:

Recent Federal and State Income Tax

Recent Fed. and State Income Tax

Chart R.13t: Recent Fed. and State Income Tax

Income tax collections are highly dependent on the economy. In recent years the federal and state governments have collected around 13 percent of GDP in income tax, but tax collections dip sharply in each recession: to 12 percent GDP in 1992, to 10 percent GDP in 2003; to 9 percent GDP in 2010.

Overall, the federal income tax collects about 80 percent of the total income tax take, and the state income taxes collect about 20 percent of the take.

US Federal and State Income Tax Since 1900

US Income Taxes since 1900

Chart R.14t: US Income Taxes since 1900

The modern federal income tax began in 1913, and quickly collected nearly 5 percent of GDP in World War I.

In the 1920s and 1930s federal income tax collections declined to 2-3 percent of GDP, but in World War II shot up to 15 percent of GDP. State income tax collections were very small, at 0.2 percent GDP in 1930 and 0.35 percent in 1940.

Since World War II the federal income tax has chugged along between 9 adn 11 percent of GDP.

Since World War II the state income taxes have slowly increased, hitting 1 percent GDP in 1969, 2 percent in 1995, peaking at 2.23 percent GDP in 2008.

Individual vs. Corporate Income Tax Shares

US Income Tax Shares

Chart R.15t: US Income Tax Shares

The income tax was initially paid only by corporations, but starting in World War I, it broke down about 50 percent between individuals and corporations.

After World War II, the corporate income tax share began to shrink, going below 40 percent share in 1950, 30 percent share in 1968, and 20 percent share in 1981.

Since the mid 1980s, the corporate income tax has fluctuated along between 15 to 20 percent of income tax collections.

Federal, State, Local Revenue in 20th Century

Total Government Revenue<br>by Government Level

Chart R.04t: Total Government Revenue
by Government Level


At the start of the 20th century, about half of government revenue was local government revenue. Out of a total of 7 percent of GDP, a full 3.5 percent was collected at the local level. Federal revenue spiked in World War I, but by the mid 1920s, local government revenue and federal revenue were about equal at 5 percent of GDP, with state revenue below 2 percent of GDP. During the 1930s this changed, as state revenue surged to 5 percent of GDP while federal revenue increased to 7 to 8 percent of GDP and local revenue increased to about 6 percent of GDP. After the spike of World War II, when federal revenue briefly hit almost 24 percent of GDP, state and local governments entered the 1950s at about 4 percent of GDP while federal revenue fluctuated between 16 and 18 percent of GDP. Since the 1950s state and local revenue has steadily increased, with state revenue reaching 10 percent of GDP and local revenue reaching 6.5 percent of GDP in 2000.

After major revenue fluctuations in the dot-com recession of 2001-02 and the Great Recession of 2008-09 federal revenue in the mid 2010s was about 17 percent GDP, state revenue 8 percent GDP and local revenue 6.5 percent GDP

Suggested Video: All About Income Tax

Top Revenue Requests:

Find DEFICIT stats and history.

US BUDGET overview and pie chart.

Find NATIONAL DEBT today.

DOWNLOAD revenue data.

See FEDERAL BUDGET breakdown and estimated vs. actual.

Check INCOME TAX details and history.

See BAR CHARTS of revenue.

Check STATE revenue: CA NY TX FL and compare.

See REVENUE ANALYSIS briefing.

See REVENUE HISTORY briefing.

Take a COURSE at Taxes 101.

Make your own CUSTOM CHART.

Revenue Data Sources

Revenue data is from official government sources.

Gross Domestic Product data comes from US Bureau of Economic Analysis and measuringworth.com.

Detailed table of revenue data sources here.

Federal revenue data begins in 1792.

State and local revenue data begins in 1820.

State and local revenue data for individual states begins in 1957.

Spending 101 Courses

Spending | Federal Debt | Revenue | Defense | Welfare | Healthcare | Education
Debt History | Entitlements | Deficits | State Spending | State Taxes | State Debt


There’s More...

usgovernmentspending.com.

Where you go to get facts about government.

Prepared by Christopher Chantrill.
email: chrischantrill@gmail.com

Click the image on the right to buy usgovernmentspending.com’s ebook.
It costs only $1.99 and it contains all the analyses of spending history
on the website and more.

More Topics

Federal Yield Curve
Click to view

Site Search

Win Cash for Bugs

File a valid bug report and get a $5 Amazon Gift Certificate.

Next Data Update

> US GDP CY16

> data update schedule.

Get the Books


Price: $0.99
Or download
for free.

From
usgovernment
spending.com
Price: $1.99

Life after liberalism Price: $0.99
Or download
for free.

US Government Spending 2020: only 99¢.

US Government Spending 2012: free.

Data Sources for 2014_2031:

Sources for 2014:

GDP, GO: GDP, GO Sources
Federal: Fed. Budget: Hist. Tables 3.2, 5.1, 7.1
State and Local: State and Local Gov. Finances

Sources for 2031:

GDP, GO: GDP, GO Sources
Federal: Fed. Budget: Hist. Tables 3.2, 5.1, 7.1
State and Local: State and Local Gov. Finances
'Guesstimated' by projecting the latest change in reported spending forward to future years

> data sources for other years
> data update schedule.

Blog

Federal Budget for FY27 Released

On April 4, 2026, we updated usgovernmentspending.com with the numbers from the Public Budget Database in the Budget of the United States Government for Fiscal Year 2027

Here is how headline budget estimates for the upcoming FY 2027 fiscal year have changed since the release of the FY 2025 budget in Winter 2024. There were no budgetary estimates in the budget documents for the FY 2026 budget.

Federal Budget Changes for 2027
$ billionEstimate for 2027
in FY2025 Budget
Estimate for 2027
in FY2027 Budget
Change
Federal Outlays$7,696.6$8,092.9 +$569.1
Federal Receipts$6,186.2$5,921.0+$279.1
Federal Deficit$1,510.3$2,171.9+$290.0

You can see line item changes from budget to budget here. You can compare budget estimates with actuals here.

Account level spending estimates through FY 2031 come from the Outlays table in the Public Budget Database and were updated on usgovernmentspending.com on April 4, 2026.

Account level budget authority estimates through FY 2031 come from the Budget Authority table in the Public Budget Database and were updated on usgovernmentspending.com on April 4, 2026. 

US GDP for 2025 Released
On March 15, 2026 usgovernmentspending.com updated its GDP series with the latest data from the Bureau of Economic Analysis ...

US, State Population Update for 2025
On January 21, 2026 the US Census Bureau released its US national and state population estimates for July 1, 2025.  On February 7, 2026 usgovernmentspending.com updated its US and state popula ...

> blog

Tax Links

us dataus chartdeficit/gdptaxes/gdpdebt/gdpus gdpus real gdpbreakdownfederalstatelocal202420252026californianew yorktexas

Masthead

usgovernmentrevenue.com was designed and executed by:

Christopher Chantrill.

Email here.


presented by Christopher Chantrill

Data Sources  •   •  Contact